Wednesday, November 28, 2012

Winter Break Bordem - Science Videos

This summer I had the wonderful joy of watching many talented YouTube artists make videos on our favorite topic: SCIENCE! Sure, we're a little late for the beginning of the year but just in time for Winter Break!

Here are a few of my favorite videos from this summer. If you find yourself wanting to learn some science this Winter Break but don't want to read those dusty textbooks check out some of these Youtuber's other videos.

1.) Paul G. Hewitt teaches the "Conservation of Momentum"
This video isn't new (2008) but it does show an entertaining way to teach a physics concept that can be difficult for students to grasp. Hewitt is a physics teacher, among other things, who is well known in the  science education world for writing a physics textbook that helped teach through analogies. His analogies and demonstrations not only make science more interesting and easy to understand but they are fun too!

2.) NPR (National Public Radio) is absolutely wonderful. They have a website and YouTube channel and their content ranges from politics to music and even science! This video here from NPR answers the question "How heavy is a hurricane?" Can you guess the weight of a hurricane in whales? The answer may surprise you.

3.)Vsauce- Michael Stevens is a science writer and the host of Vsauce. This channel has many interesting videos; some on video games, science news, fun things to-do online and nifty things people have created. Vsauce has a few side channels as well, including vsauce2, (new) vsauce3, and vsaucegaming. This video explains why people are ticklish and why some people think it is actually painful.


4.)Veritasium- America is definitely not the only country with scientists. This vlogger is from Australia and did his Ph.d on teaching science through videos. This video explains common misconceptions about temperature by interviewing people on the streets in Australia. Go ahead, watch this video and learn why some materials feel colder than others.

5.) Crashcourse is a new Youtube channel created by two brothers. Each brother tackles an AP subject. The first two subjects were World History and Biology. This is the first video in the Biology segment. (Just now starting is a segment on Ecology.) If biology is your thing you should watch these videos that are done by Hank Green, who got his Ph.D in environmental biology.

6.)ASAPscience - I recently came upon this science channel. Their tagline is "Got a burning question?" They have about 50 videos on many different topics in science. Ever wonder why people get hangovers? Want to know know about the age of earth? Or maybe you just wondered how Spiderman's powers work, this is the channel to keep an eye on.

7.) Is astronomy more your thing? SpaceLab is a youtube channel that has playlists of astronomy related things. They also have connections with the International Space Station. Neil DeGrasse Tyson has been interviewed a few times on their channel and their normal host is... Bill Nye the Science guy!

8.)SciShow is the place to go for science news. This channel is written and hosted by Hank Green (of CrashCourse) and mainly focuses on science news. There are some videos of explanation and even a few on labs you can do at home.

9.) MelodySheep - Lastly, this channel takes clips from movies, documentaries and speeches about different topics and turns them into a catchy auto-tune song of science! 

Wednesday, July 11, 2012

Guest Blog: Google Earth in the Classroom


Hi, I am Geoblogger Brian Schrock, author of the blog Google Earth Time Machine and I'm here doing a guest blog for my lovely friends Caroll and Rachel.  As my blog indicates, I'm a frequent user of Google Earth and after years of enjoying the program, I've learned a few tricks that I think could really add to the science classroom.  While Google Earth has revolutionized cartography (being our most complete map of the planet), it also has many additional features and applications that merge geography with the realms of geology, biology, oceanography, environmental science, meteorology, and other disciplines.  I plan on introducing a few of these features and applications to y'all today.


Oceanography:

After downloading the most recent version of Google Earth (which is a free download for those who didn't know) one of the features that comes with the program is a layer titled Ocean.  When this layer is selected many different contributions by groups like National Geographic have content for the user to explore.  Articles, images, videos, and links to webpages are georeferenced to areas all over the world's oceans:

Notice the ocean layer at the bottom left.  These are just some of the materials included.

The amount of material available to teachers here is astounding.  While elementary students might struggle with comprehending some of the material on their own, middle school and especially high school students would be able to browse these articles in an environmental science, oceanography, or biology class.  Never underestimate the amount of free resources provided here!


Meteorology:

Like the Ocean layer that comes with Google Earth, there is also a Weather layer that provides frequently updated radar, satellite, and temperature details for the world.  The same kind of information can be found online but with the right tools, this information can be enhanced.  There is a website that gives free downloads of Hurricane Hunter data.  This data is updated real-time (even while they are in flight!) and show's the track of the Hurricane Hunter plane as it flies into tropical systems.  It even provides wind speed and barometric data as it goes.  You can know if a storm has become a hurricane before the National Hurricane Center even officially announces it!

(photo from www.gearthblog.com)

During the Atlantic hurricane season, this kind of information can really expose a science classroom to meteorology as it is occurring!


Environmental Science:

Google Earth comes with an entire set of layers dedicated to global awareness.  These range from issues with pollution and famines, to the activities of World Wildlife Fund and Greenpeace.  One of the issues that I found most intriguing as a geology student was mountain-top removal.  Google Earth has a layer dedicated to raising awareness about the removal of mountaintops for coal mining.  In addition to this layer, they have another technical feature called a time-slider. The time slider allows the user to view historical imagery as far back as they have records.  So for one of these mountains in particular, I created a blog of how the mountain was removed overtime.  This time slider is one of my favorite features on Google Earth and the main source of my blog material!


The above picture shows deforestation in the Amazon Rainforest.  Using the map scale bar at the bottom left of the satellite image, students can measure the area of deforestation and get an idea of how expansive this problem is.


Geology:

I got my bachelor's degree in geology so I've done quite a bit of exploring using Google Earth in this subject area.  ...In other words, please excuse me for making this section of my blog post much longer than the others.  I teach what I know!

Google Earth opens up a whole new realm of geologic study.  While many people use it for it's satellite features, it is easy to forget about the structural features it can show.  For instance, if I zoom into the sky above Mt. St. Helens, I see this:


However, if I tilt my angle of view towards the horizon, I now see a structural, 3D view of the mountain:


I can go even further by downloading a free topographic map overlay for Google Earth and applying it like so:


This kind of view can give the classroom an interactive view of large features like mountains, volcanoes, and meteor craters.

Another great interactive feature is the elevation profile tool.  Google Earth has a measuring tool located near the top of the screen that looks like a ruler.  It can be drawn across the map as a line or a path and then saved.  When right-clicked, an option for Show Elevation Profile becomes available.  Selecting this will show something like this:


This image shows students the shape of the Mississippi River Floodplain across 13 miles at the Iowa-Illinois border.  After introducing this tool to students, a potential project could be to give them various locations and have them use this tool to describe landforms that can't easily be seen on the small scale.  The applications are pretty enormous!


Summary:

I would encourage any future teacher, especially in science, to become familiar with this program.  It is user friendly and completely free.  The sheer amount of material available allows for all kinds of exploration, study, and activity that I have barely even skimmed the surface on.  Students, particularly in America, are missing out on geographical perspectives and relating science to geography can really help broaden their knowledge in both areas.  If you have any further questions regarding classroom activity ideas, using the program, or general clarification, please contact me on Google+ or through email, or leave a comment on this blog post!

-Brian


All image screenshots from Google Earth are copyright Google.


This blog and its author are not affiliated with Google that produces and owns Google Earth


Google and Google Earth are trademarks of Google Inc.

Tuesday, July 3, 2012

Positively pH Explained

The last experiment we did was on testing the pH of common household items. First off, we hope you had fun. This lab is a wonderful learning experience and it captures your attention with the many different colors. With that, lets get started on understanding this lab!

pH is considered a chemical property. If you haven't learned about those, there are two properties: Chemical and Physical. Physical properties are things such as color, taste, and smell. Chemical properties are ones like pH, boiling point and melting point.

Physical Properties do not change the chemical make up of something.
Chemical Properties do change the chemical make up.

pH is a way to measure how acidic or basic a chemical, compound or material is. Acids have a lower number on the pH scale while bases have higher numbers. The number seven is neutral. A common neurtal substance is... water!

Something to remember, the pH scale is logorithmic. This means that the values are 10 time different than each other. For example: A pH of 2 is 10 times more acidic than a pH of 3. However it is 100 times more acidic than a pH of 4. Why? Because between 2 and 3 is an amount of 10 and between 3 and 4 is another amount of 10. To find how much more acidic 2 is than 4 you multiply the two sets of ten.

So 2 is 10x more acidic than 3.
2 is 100x more acidic (10 times 10) than 4.
2 is 1000x more acidic (10 times 10 times 10) than 5.
Scale for Litmus Paper
There are different ways the pH level of something can be measured. The most common way in a science lab is to use litmus paper.

Litmus paper changes color based on the acidity or alkalinity of a substance.
Acidity: How acidic a substance is, the more acidic the lower the number.
Alkalinity: How basic a substance is, the more basic the higher the number.

Normally there are two colors of litmus paper, red and blue. Each color tests for something different. Red litmus paper checks for basic solutions and blue litmus paper checks for acidic.
A handy way to remember which paper to use:


Red turns Blue if it is Basic.
Blue turns Red it is it Acidic.

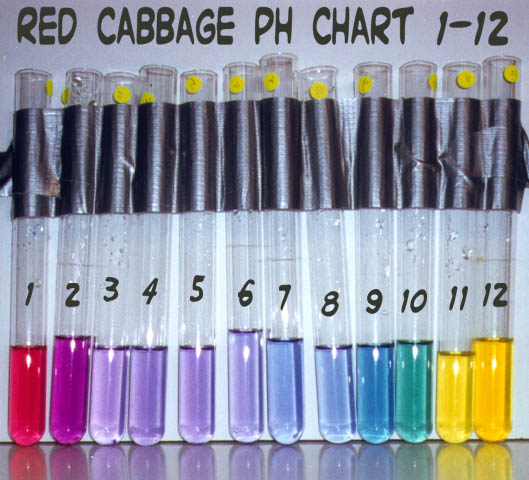
For this experiment we used a solution made from red cabbage, so the colors for the ranges of pH are different than litmus.
Basic is Yellow.
Acidic is Pink.
Neutral is Blue.
(Neutral is blue because the cabbage juice is a blue color. )

So how does cabbage juice work to determine whether something is acidic or basic?
Ideal Red Cabbage Colors
Cabbage juice is a neutral substance so it is good for testing the pH of a substance. The reason a red cabbage is the purple color is because of something called a flavin, this is a water soluble pigment. This pigment changes colors in different pH levels. The reason for this change is because of hydrogen.

The indicator changes colors because it detects the ratio of hydroxide to hydronium ions.
Hydroxide: Negatively charged, anion made of one hydrogen and one oxygen. OH-
Hydronium: Positively charged, cation made of three hydrogen and one oxygen. H30+

When something is acidic there are more hydronium ions than hydroxide.
When something is basic there are more hydroxide ions than hydronium.
When something is neutral (like water or red cabbage juice) the amounts are equal.

Simple things like lemons are acidic and we know this because of their sour and sharp taste. Things that are basic are often used as cleaning supplies because they take away protons, or make things negatively charged. Basic substances have a soapy feel when on your hands, common laundry soap is basic.
Lemon, and citrus is the iconic 'fresh scent'
WARNING: When working in the lab it is dangerous to touch acids and bases (especially strong ones) these are dangerous.

Some Lovely Links: These links also tell how to do this experiment. It's common, simple and great!
-http://www.sciencebuddies.org/science-fair-projects/project_ideas/Chem_p013.shtml
-http://www.stanford.edu/~ajspakow/downloads/outreach/ph-student-9-30-09.pdf
-http://chemistry.about.com/od/acidsbase1/a/red-cabbage-ph-indicator.htm
-http://web.jjay.cuny.edu/~acarpi/NSC/7-ph.htm

Please Note: Red Cabbage can have a very strong odor, one that some do not enjoy. Thankfully science can help with this. Over at Spangler Science (lots of supplies!) they have Jiffy Juice, this stuff is great! It is a condensed, power version of Red Cabbage and is odorless! So if you plan on doing this experiment more than once or need a lot of it (especially for schools) this stuff is great. http://www.stevespanglerscience.com/product/1552

Friday, April 27, 2012

Positively pH

In this experiment we are going to show you a very simple and colorful way to learn the difference between the acids and bases in your home!

Materials:
- 1 Head Red Cabbage
- Lemon Juice
- Aspirin
- Vinegar
- Baking Soda
- Epsom Salt
- Tums

1.) Boil the red cabbage until the water turns a blue-ish. (This takes all of the color out of the cabbage)


2.) Let the cabbage juice cool. (This juice is best used fresh, after about 3 days the juice doesn't work as well for this experiment.)


3.) Pour a little bit of cabbage juice into 7 test tubes.


4.) In each test tube add a little of each item. (So in one tube add some aspirin and baking soda in another.)
Leave the last test tube empty as a control.

5.) Compare the colors in each tube. The tube with lemon juice should be a distinct pink color while the baking soda is a blue-green color.

The acids in this experiment will turn a pink or light purple color while the bases will be blue-green.
You can use the red cabbage juice to find out if other things in your house are acidic or basic too! Go try some soap, apple juice, or even a little of that soup you had for dinner!